Build a ClickHouse Telemetry Pipeline with OpenTelemetry and GlassFlow
Build a ClickHouse Telemetry Pipeline with OpenTelemetry and GlassFlow
Build a ClickHouse Telemetry Pipeline with OpenTelemetry and GlassFlow
This guide shows you how to stream OTLP data, perform deduplication and PII masking with GlassFlow and send data directly into ClickHouse for high-performance, low-cost observability.
Written by
Armend Avdijaj
ClickHouse has become a popular choice for observability because it can store and query high-volume telemetry data at a fraction of the cost of many hosted platforms. For small and mid-sized companies, that makes it attractive: you can keep more data, query it quickly, and avoid sending every trace, log, or metric to an expensive black-box service.
The challenge is getting telemetry into ClickHouse reliably. OpenTelemetry gives you a standard way to collect data from applications, but you still need to handle duplicate retries, sensitive attributes, schema mapping, batching, and backpressure before the data reaches ClickHouse.
This guide shows one practical architecture using the GlassFlow OTel Connector: a native OTLP ingestor built into GlassFlow that accepts telemetry from the OpenTelemetry Collector, applies streaming transformations, and writes efficient batches into ClickHouse.
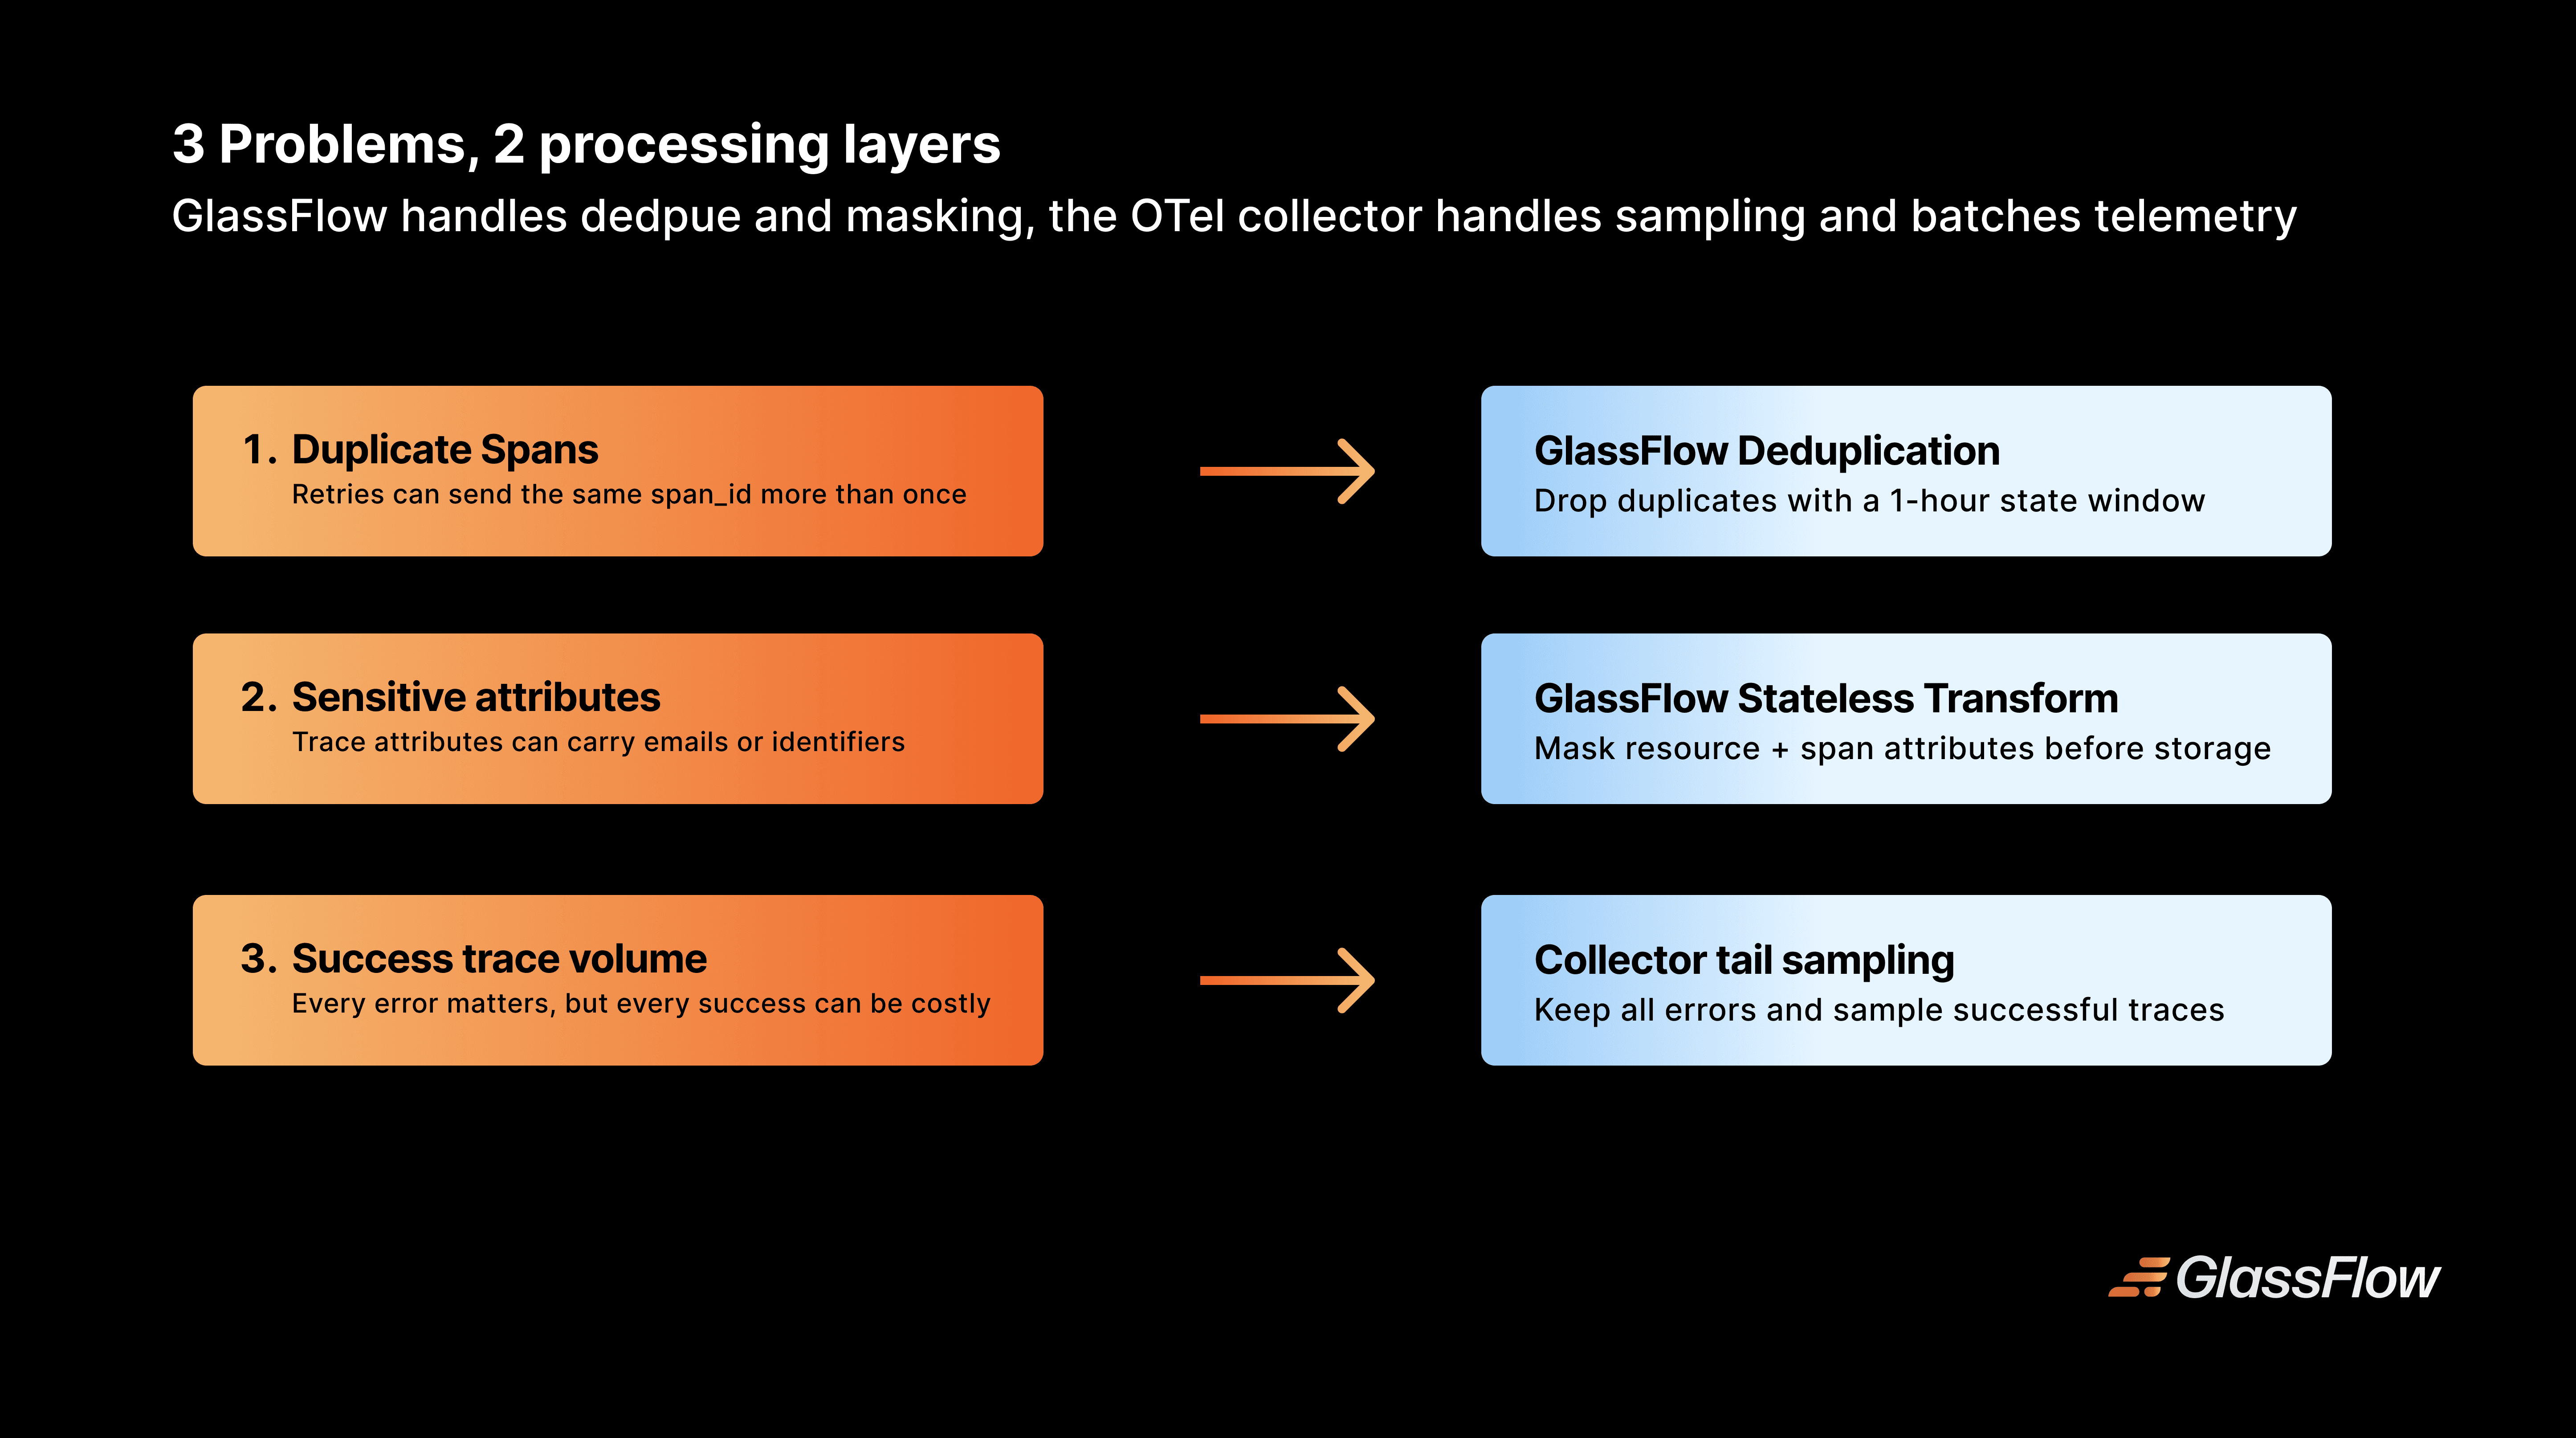
The companion demo in this repository is traces-only so the moving parts are easy to understand. It walks through three common telemetry concerns: duplicate spans after retries, sensitive data in trace attributes, and cost from retaining every successful trace. GlassFlow handles span deduplication and stateless masking, while the OpenTelemetry Collector handles tail sampling before data is written to ClickHouse. The same OTLP pattern can be extended to logs and metrics.
Why ClickHouse Telemetry Pipelines Need a Streaming Layer
The simplest ClickHouse observability architecture looks like this:
That can work for early experiments, but production telemetry usually needs a processing step before storage:
Deduplication: collector retries and network interruptions can produce duplicate spans or events.
Schema control: OTLP payloads need to land in ClickHouse-native columns and types.
Cost control: successful traces are often high-volume and low-value compared with errors, and even some known error classes may be noise you do not want to store.
Privacy controls: emails, IDs, tokens, and other sensitive attributes should be removed before storage.
Backpressure and batching: ClickHouse performs best when inserts are batched and paced.
Some teams solve this with Kafka between the collector and ClickHouse. Kafka is valuable when you need durable replay, long retention, or several independent consumers. But if your primary goal is to stream telemetry into ClickHouse, running brokers, partitions, topics, and consumer groups can be more infrastructure than a smaller team wants to own.
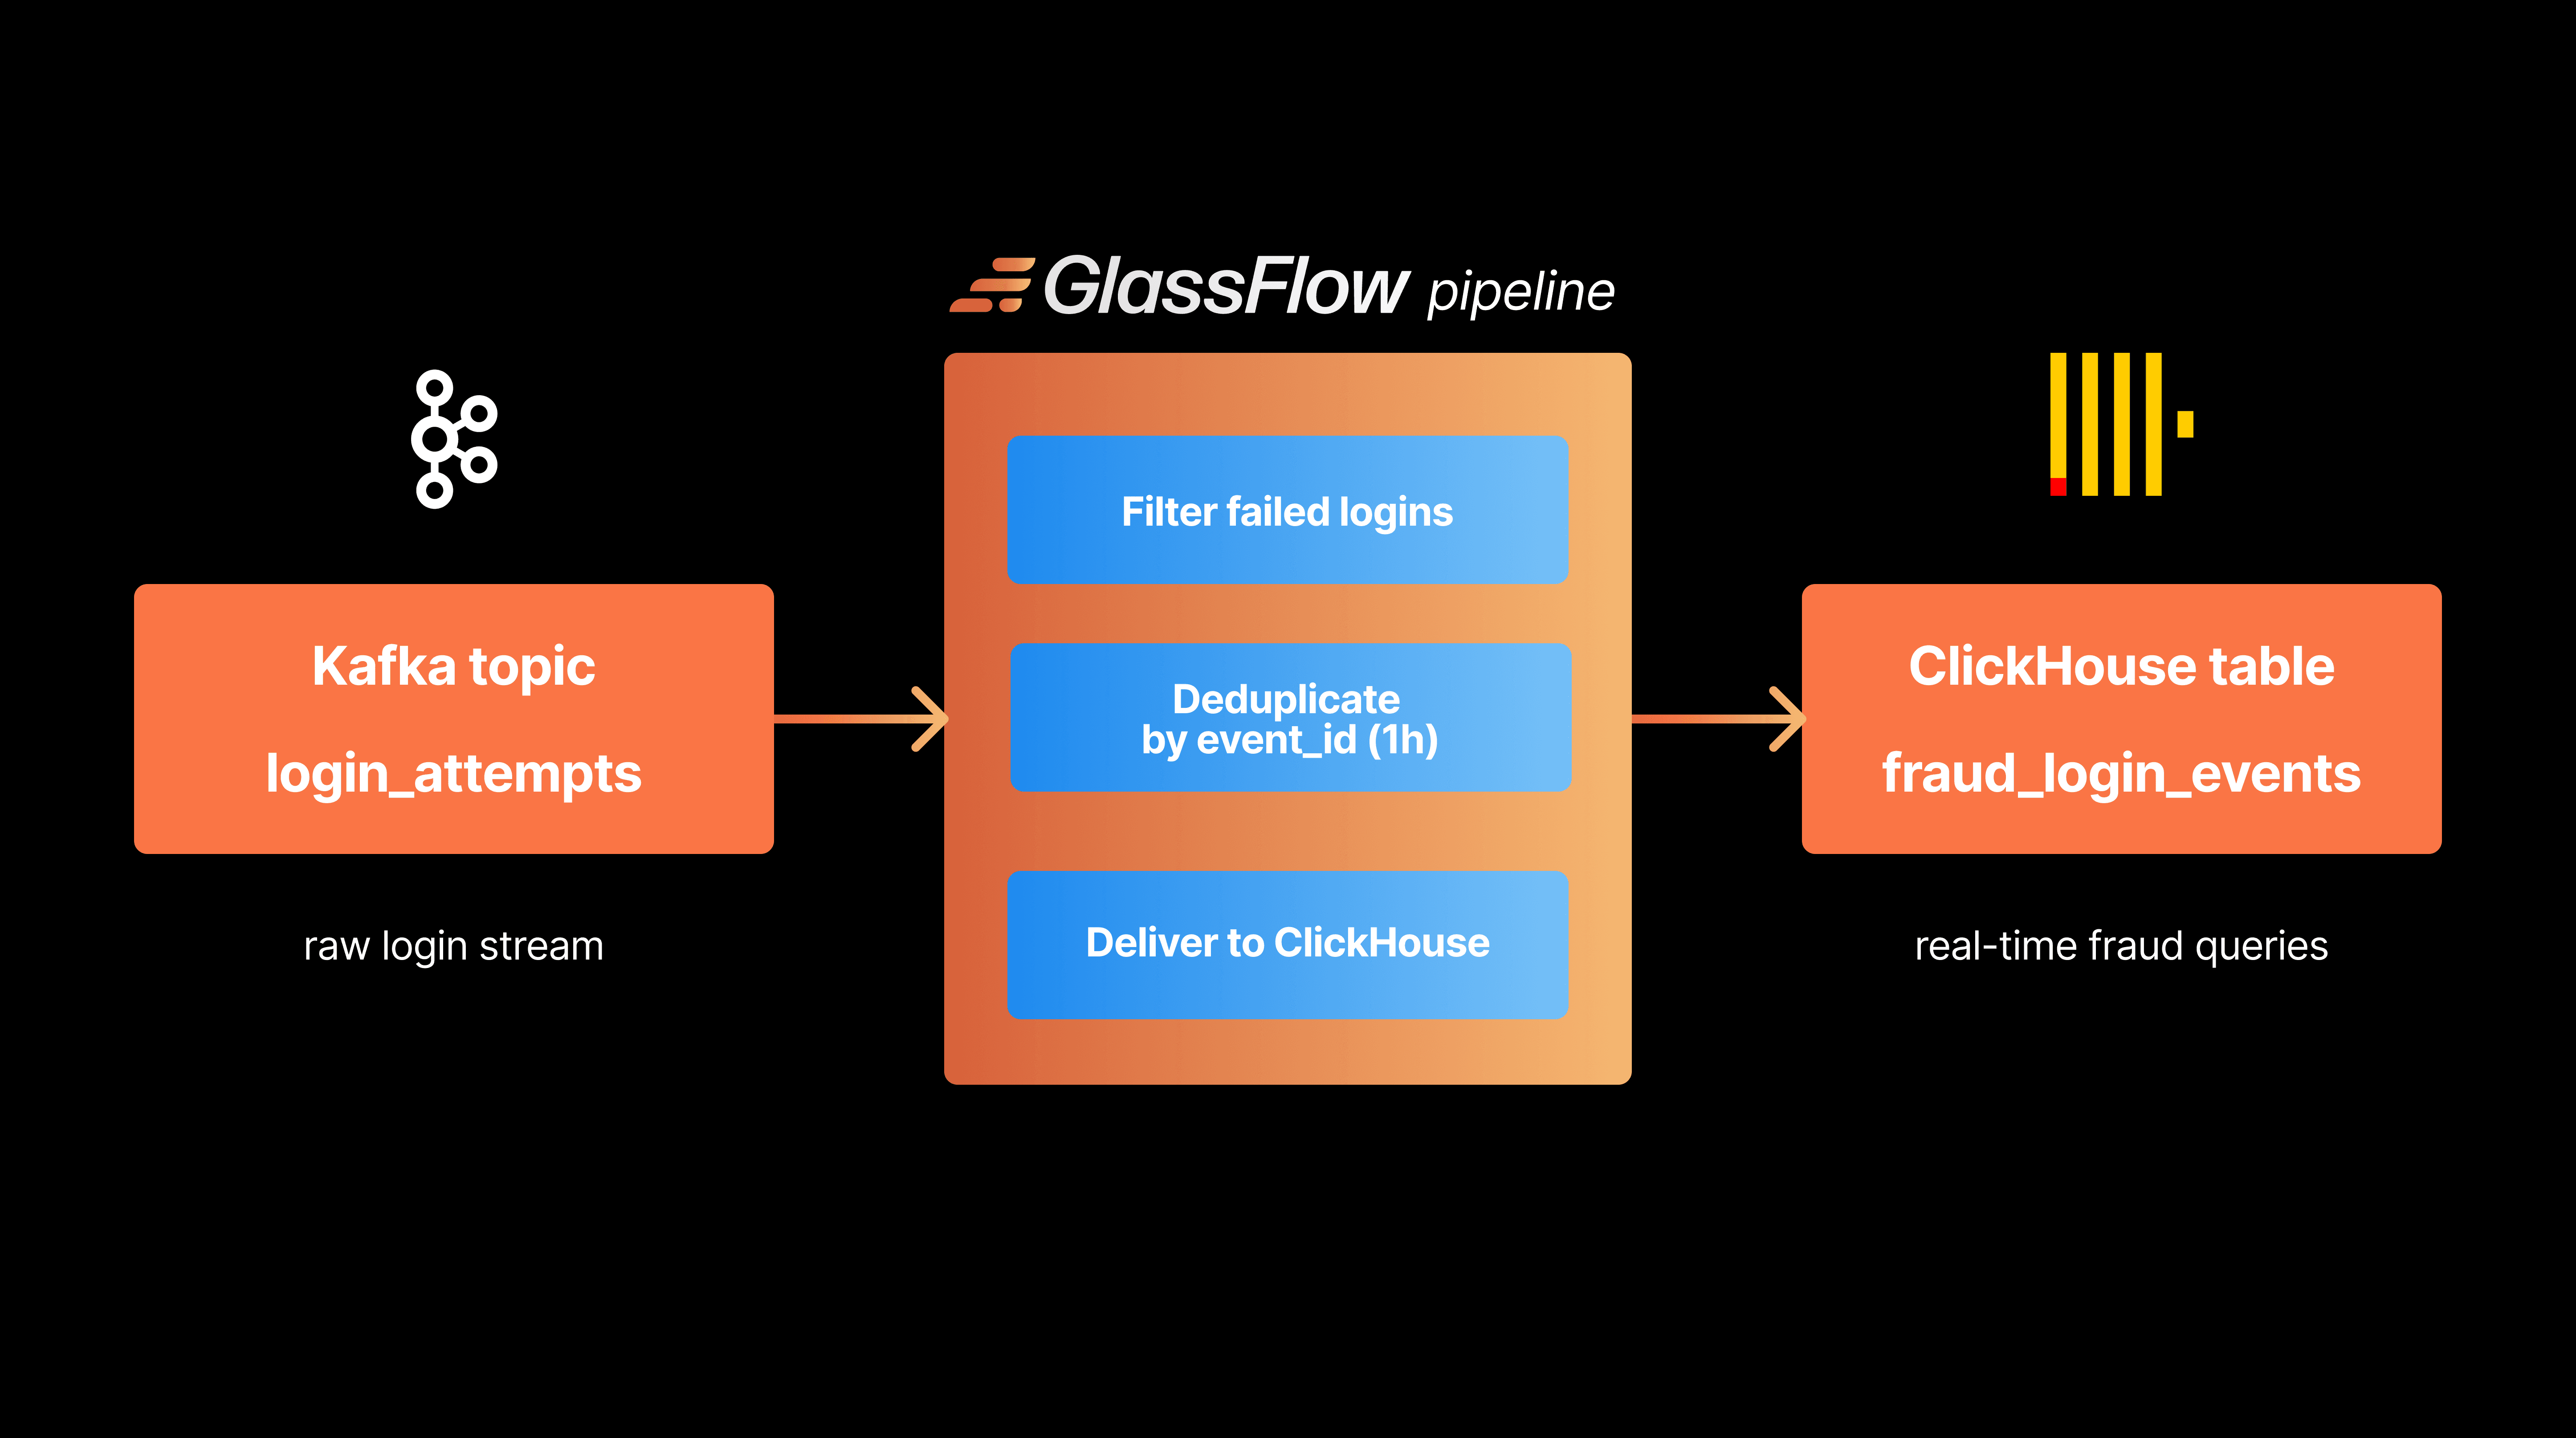
The GlassFlow OTel Connector
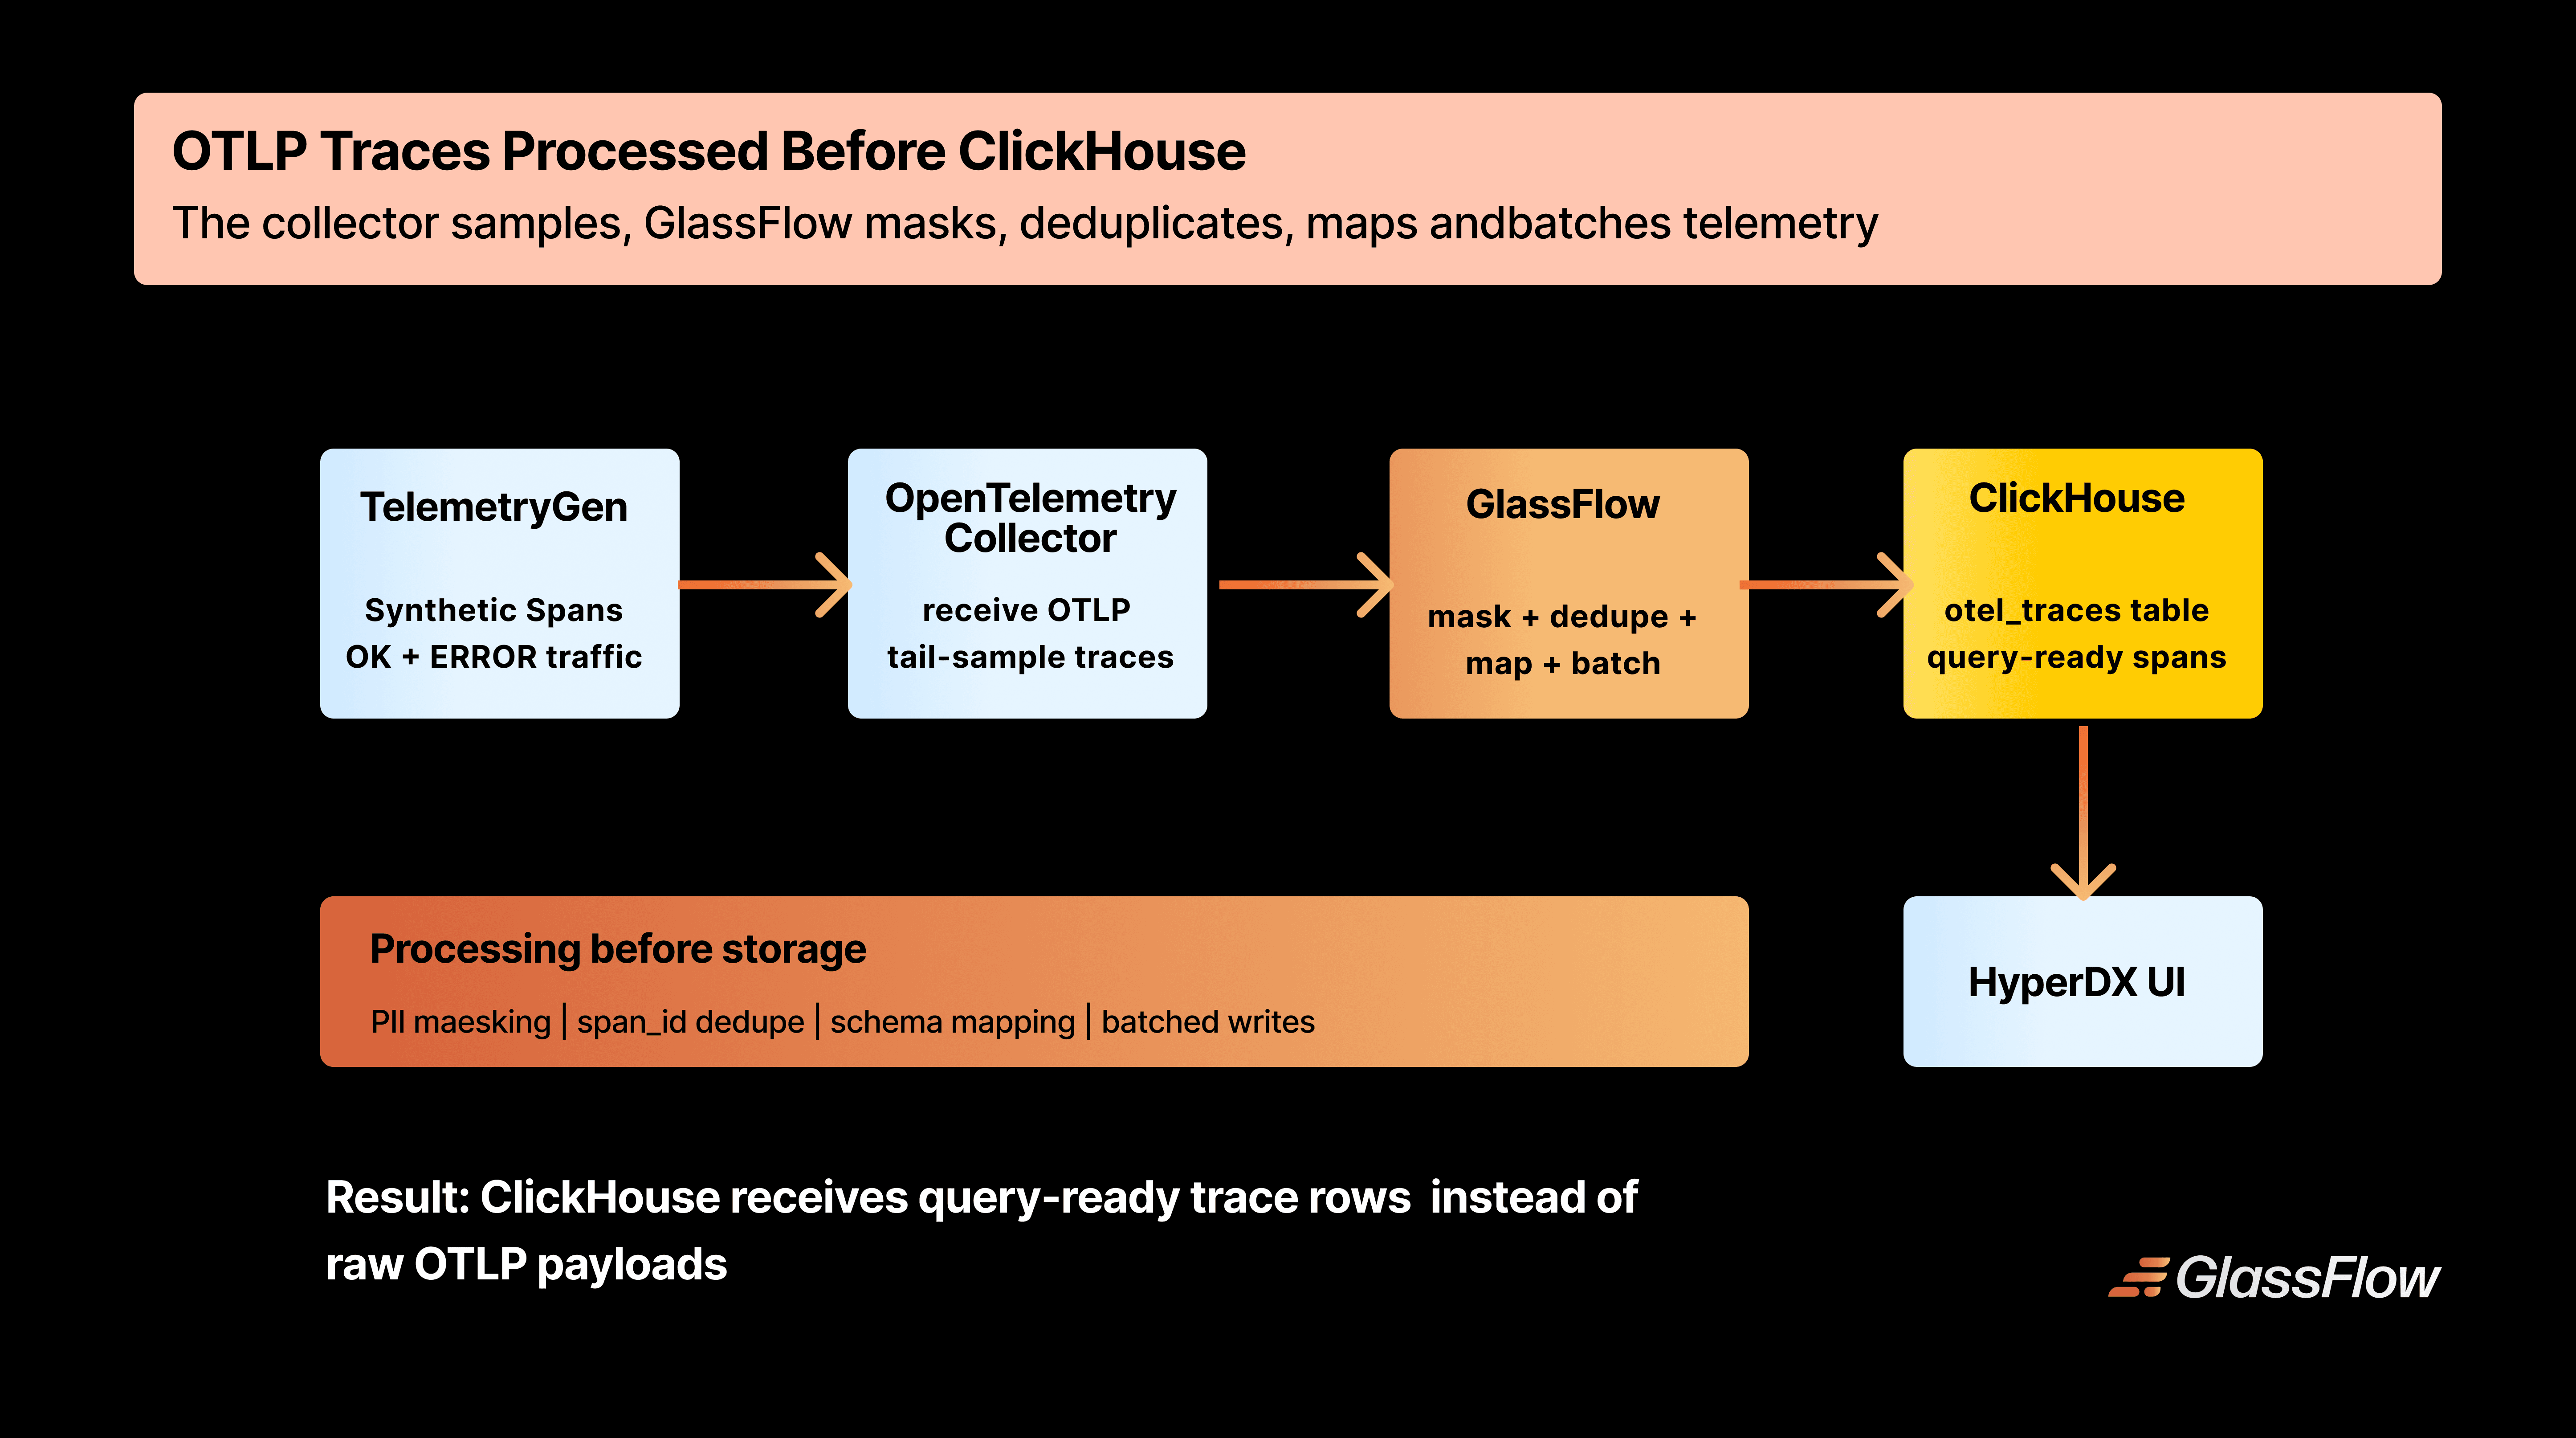
GlassFlow natively understands OTLP — the wire protocol used by every OpenTelemetry SDK and the OTel Collector. When you create a pipeline with an OTLP source type (for example, otlp.traces), GlassFlow provisions an OTLP ingestor endpoint inside your cluster.
The OTel Collector routes traces directly to the GlassFlow pipeline endpoint over gRPC or HTTP. No Kafka, no custom plugins, no topic management.
Figure 1: OTLP traces flow from the collector into GlassFlow, then into ClickHouse for storage and HyperDX for exploration.
GlassFlow provides the streaming pieces that are easy to underestimate when building on ClickHouse:
Real-time deduplication — removes duplicate spans using a configurable key and time window. The demo uses span_id with a one-hour window, but the same mechanism can be set to longer windows when retries or replays arrive much later.
Filtering before storage — drops telemetry you know you do not need, including noisy error classes, health-check spans, or low-value success traffic.
Schema mapping — converts OTLP field types to ClickHouse-native types (e.g., Map(String, String), LowCardinality(String), DateTime64(9))
Batched writes — buffers records in memory and flushes to ClickHouse in efficient bulk inserts
Backpressure handling — applies flow control so ClickHouse is not overwhelmed
Horizontal scaling — GlassFlow can scale ingestion and sink components with replicas; the published performance benchmark shows roughly linear scaling up to about 510k events/sec at 10 replicas.
Pipeline definitions use the API v3 shape: a sources array, optional transforms (including deduplication), and a sink with nested connection_params and mapping. That matches all current GlassFlow ETL APIs and keeps routing explicit per pipeline.
What We're Building
By the end of this guide, you'll have a Kubernetes-based traces pipeline:
Pipeline
Source
Sink table
otlp-traces
OTLP traces
otel_traces
We'll use telemetrygen with two containers in one Job: mostly successful spans at ~45/s and error spans at ~5/s, each carrying demo attributes (user_email, demo_ssn) so you can verify redaction in the GlassFlow pipeline before data reaches ClickHouse. The collector runs tail sampling so you keep all error traces and a small fraction of successful ones. The OTel Collector configuration pattern applies to any OTLP-compatible SDK or agent.
Figure 2: Each demo concern is handled in the layer where it is cheapest and safest to apply.
Prerequisites
kubectl configured against a cluster (kind works for local development)
helm ≥ 3.12
clickhouse-client (for verification queries)
make (the demo wraps kind, Helm, and curl in a small Makefile)
A machine with at least 4 CPU cores, 8 GB RAM, and roughly 10 GB disk space for the bundled stack
All demo files are available in the demos/observability-v2 directory of this repository.
Step 1 — Create the Cluster
cd clickhouse-etl/demos/observability-v2make cluster
cd clickhouse-etl/demos/observability-v2make cluster
cd clickhouse-etl/demos/observability-v2make cluster
This creates a kind cluster named observability-v2 (override with CLUSTER_NAME) using the demo's node image and config. If you're using an existing cluster, skip this step.
Step 2 — Add Helm Repositories and Create Namespaces
make reposmake ns
make reposmake ns
make reposmake ns
Under the hood, this adds opentelemetry, glassflow(https://glassflow.github.io/charts), and clickstack, runs helm repo update for only those three repos, and ensures the otel, glassflow, and hyperdx namespaces exist.
Step 3 — Deploy the Stack
make install
make install
make install
This installs, in order: the OpenTelemetry Collector, GlassFlow ETL from the published glassflow/glassflow-etl chart by default, and ClickStack (HyperDX with embedded ClickHouse). The demo pins GLASSFLOW_CHART_VERSION=0.5.16; you can override GLASSFLOW_CHART if you want to test a local chart archive instead.
The Helm values (k8s/helm-values/glassflow.values.yaml) enable the OTLP receiver, size resources for a local cluster, and disable the Kafka gateway on the UI:
After install, make status shows pod state in each namespace.
Step 4 — Deploy the GlassFlow Pipeline
The HTTP API listens on port 8081 inside the cluster. Forward localhost:8080 → 8081 so the default GLASSFLOW_API_URL used by the Makefile works:
make pf-glassflow-api
make pf-glassflow-api
make pf-glassflow-api
In another terminal, create the pipeline:
make deploy-pipelines
make deploy-pipelines
make deploy-pipelines
This POSTs glassflow-pipelines/traces-pipeline.json to POST /api/v1/pipeline. If port 8080 is busy, forward the API on another port and set GLASSFLOW_API_URL, for example:
kubectl port-forward -n glassflow svc/glassflow-api 18080:8081GLASSFLOW_API_URL=http://localhost:18080 make deploy-pipelines
kubectl port-forward -n glassflow svc/glassflow-api 18080:8081GLASSFLOW_API_URL=http://localhost:18080 make deploy-pipelines
kubectl port-forward -n glassflow svc/glassflow-api 18080:8081GLASSFLOW_API_URL=http://localhost:18080 make deploy-pipelines
What's in a pipeline definition?
The traces pipeline uses v3 JSON: sources, transforms, and sink with connection_params aligned to your ClickHouse credentials (these must match k8s/helm-values/hyperdx.values.yaml and the table DDL):
sources: otlp.traces with a stable source_id ties transforms to the OTLP stream.
Dedup transform: duplicate deliveries (for example collector retries) collapse on span_id inside a one-hour window before ClickHouse.
Stateless transform: the demo rewrites the OTLP resource and span attribute maps with [REDACTED] values for user_email and demo_ssn; resource_attributes['service.name'] is passed through so HyperDX and ClickHouse can still group by service.
sink.connection_params: in-cluster DNS for ClickHouse plus credentials; keep these in sync if you rotate passwords.
sink.mapping: maps OTLP fields to ClickHouse column types; Map(String, String) fits dynamic resource and span attributes, while ServiceName is derived in ClickHouse from ResourceAttributes['service.name'].
GlassFlow exposes a unified OTLP receiver (glassflow-otlp-receiver.glassflow.svc.cluster.local:4317). The collector sets x-glassflow-pipeline-id: otlp-traces on export so traffic lands in this pipeline.
Step 5 — Create the ClickHouse Table
Port-forward ClickHouse (bundled with the HyperDX Helm release):
This runs clickhouse/create_otel_tables.sql, which defines otel_traces only — span fields, resource and scope maps, a derived ServiceName, and bloom filters on trace, span, service, status, and attribute fields.
Schema highlights
otel_traces — stores distributed spans. Together with GlassFlow deduplication on span_id, each span identifier should appear once within the configured time window. That means ClickHouse can answer trace queries without ReplacingMergeTree cleanup or FINAL reads:
CREATE TABLE IF NOT EXISTS otel_traces(`Timestamp` DateTime64(9) CODEC(Delta(8),ZSTD(1)),`TraceId`String CODEC(ZSTD(1)),`SpanId`String CODEC(ZSTD(1)),`ParentSpanId`String CODEC(ZSTD(1)),`TraceState`String CODEC(ZSTD(1)),`SpanName`LowCardinality(String)CODEC(ZSTD(1)),`SpanKind`LowCardinality(String)CODEC(ZSTD(1)),`ResourceAttributes`Map(String,String)CODEC(ZSTD(1)),`ServiceName`LowCardinality(String)DEFAULT ResourceAttributes['service.name']CODEC(ZSTD(1)),`ScopeName`String CODEC(ZSTD(1)),`ScopeVersion`String CODEC(ZSTD(1)),`SpanAttributes`Map(String,String)CODEC(ZSTD(1)),`Duration`UInt64 CODEC(ZSTD(1)),`StatusCode`LowCardinality(String)CODEC(ZSTD(1)),`StatusMessage`String CODEC(ZSTD(1)),INDEX idx_trace_id TraceId TYPE bloom_filter(0.001)GRANULARITY 1,INDEX idx_span_id SpanId TYPE bloom_filter(0.001)GRANULARITY 1)ENGINE = MergeTree()PARTITION BY toDate(Timestamp)ORDER BY(ServiceName,Timestamp,TraceId,SpanId);
CREATE TABLE IF NOT EXISTS otel_traces(`Timestamp` DateTime64(9) CODEC(Delta(8),ZSTD(1)),`TraceId`String CODEC(ZSTD(1)),`SpanId`String CODEC(ZSTD(1)),`ParentSpanId`String CODEC(ZSTD(1)),`TraceState`String CODEC(ZSTD(1)),`SpanName`LowCardinality(String)CODEC(ZSTD(1)),`SpanKind`LowCardinality(String)CODEC(ZSTD(1)),`ResourceAttributes`Map(String,String)CODEC(ZSTD(1)),`ServiceName`LowCardinality(String)DEFAULT ResourceAttributes['service.name']CODEC(ZSTD(1)),`ScopeName`String CODEC(ZSTD(1)),`ScopeVersion`String CODEC(ZSTD(1)),`SpanAttributes`Map(String,String)CODEC(ZSTD(1)),`Duration`UInt64 CODEC(ZSTD(1)),`StatusCode`LowCardinality(String)CODEC(ZSTD(1)),`StatusMessage`String CODEC(ZSTD(1)),INDEX idx_trace_id TraceId TYPE bloom_filter(0.001)GRANULARITY 1,INDEX idx_span_id SpanId TYPE bloom_filter(0.001)GRANULARITY 1)ENGINE = MergeTree()PARTITION BY toDate(Timestamp)ORDER BY(ServiceName,Timestamp,TraceId,SpanId);
CREATE TABLE IF NOT EXISTS otel_traces(`Timestamp` DateTime64(9) CODEC(Delta(8),ZSTD(1)),`TraceId`String CODEC(ZSTD(1)),`SpanId`String CODEC(ZSTD(1)),`ParentSpanId`String CODEC(ZSTD(1)),`TraceState`String CODEC(ZSTD(1)),`SpanName`LowCardinality(String)CODEC(ZSTD(1)),`SpanKind`LowCardinality(String)CODEC(ZSTD(1)),`ResourceAttributes`Map(String,String)CODEC(ZSTD(1)),`ServiceName`LowCardinality(String)DEFAULT ResourceAttributes['service.name']CODEC(ZSTD(1)),`ScopeName`String CODEC(ZSTD(1)),`ScopeVersion`String CODEC(ZSTD(1)),`SpanAttributes`Map(String,String)CODEC(ZSTD(1)),`Duration`UInt64 CODEC(ZSTD(1)),`StatusCode`LowCardinality(String)CODEC(ZSTD(1)),`StatusMessage`String CODEC(ZSTD(1)),INDEX idx_trace_id TraceId TYPE bloom_filter(0.001)GRANULARITY 1,INDEX idx_span_id SpanId TYPE bloom_filter(0.001)GRANULARITY 1)ENGINE = MergeTree()PARTITION BY toDate(Timestamp)ORDER BY(ServiceName,Timestamp,TraceId,SpanId);
Step 6 — Configure the OTel Collector
The OTel Collector is the bridge between your instrumented services and GlassFlow. This setup uses the standard otel/opentelemetry-collector-contrib image with the built-in OTLP exporter, plus tail_sampling for cost-aware retention. Masking happens in the GlassFlow pipeline, so the collector config stays focused on receiving OTLP, sampling, batching, and forwarding.
The demo installs the collector via Helm (make install). The relevant fragment of k8s/helm-values/otel-collector.values.yaml:
The collector still decides which traces to keep, but it no longer mutates attributes. In this demo, GlassFlow stateless transformations write redacted demo values for both ResourceAttributes and SpanAttributes before the ClickHouse sink. For production-grade PII handling, treat this as a pattern for pipeline-owned field-level masking; broader regex-style scrubbing may still belong in an SDK, collector processor, or another edge component, depending on your compliance boundary.
Step 7 — Generate Synthetic Traces
make telemetry
make telemetry
make telemetry
This applies k8s/telemetry/telemetrygen-traces.yaml: one Job with two containers — ~45 spans/s with Ok and ~5/s with Error, each attaching demo PII attributes for redaction checks. For example:
Note: The collector service name is otel-opentelemetry-collector — the Helm release name (otel) is prefixed by the chart when mode: deployment creates a ClusterIP service.
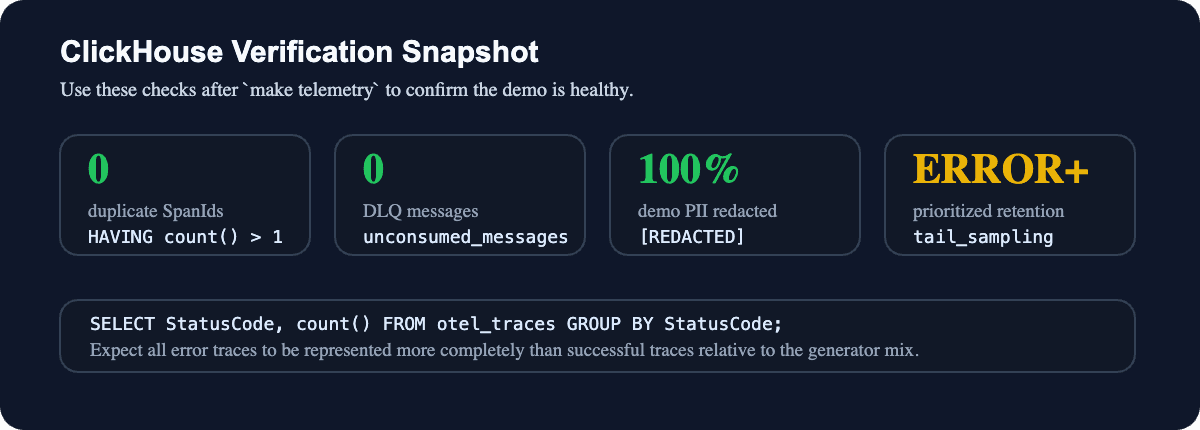
Within about a minute, traces should appear in HyperDX. Because of tail sampling, you should see far more ERROR rows per capita than OK rows in otel_traces relative to the generator mix.
Step 8 — Explore in HyperDX and GlassFlow
HyperDX (ClickStack):
make pf-hyperdx
make pf-hyperdx
make pf-hyperdx
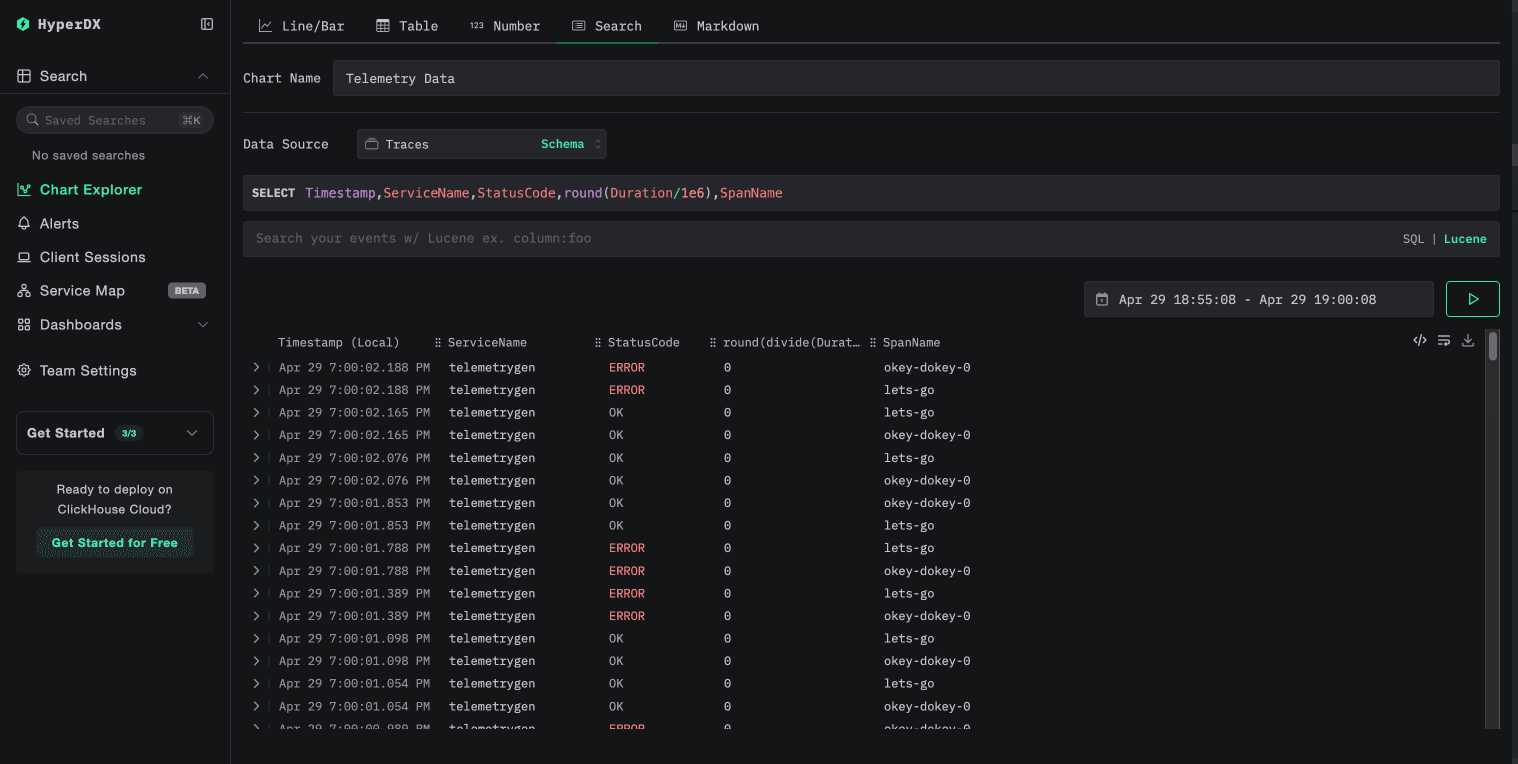
Open `http://localhost:8090`. Navigate to **Search** once in the Chart Explorer view and you should see the incoming spans.
Figure 3: HyperDX querying trace telemetry stored in ClickHouse.
GlassFlow UI uses local 8081 so the API can keep 8080:
make pf-glassflow
make pf-glassflow
make pf-glassflow
Open http://localhost:8081, open Pipelines, and confirm otlp-traces is running. Keep make pf-glassflow-api running if you still need the API on http://localhost:8080.
Verifying Data Quality
With ClickHouse port-forward active, run:
Figure 4: A healthy run has no duplicate span IDs, no DLQ backlog, masked demo PII, and error-prioritized retention.
-- Volume by status(after tailsampling)SELECT StatusCode,count()AS nFROM otel_tracesGROUP BY StatusCodeORDER BY n DESC;
-- Dedup:no duplicate span_id within the GlassFlow windowSELECT SpanId,count()AS cFROM otel_tracesGROUP BY SpanIdHAVING c > 1LIMIT 20;
-- Redaction:latest rows should show[REDACTED]inboth resource and span mapsSELECTcount()AS latest_rows,countIf(ResourceAttributes['user_email'] = '[REDACTED]')AS redacted_resource_email,countIf(ResourceAttributes['demo_ssn'] = '[REDACTED]')AS redacted_resource_ssn,countIf(SpanAttributes['user_email'] = '[REDACTED]')AS redacted_span_email,countIf(SpanAttributes['demo_ssn'] = '[REDACTED]')AS redacted_span_ssn,countIf(arrayExists(x -> x IN ('[email protected]','[email protected]','000-00-0000','999-99-9999'),mapValues(ResourceAttributes)))AS raw_resource_attr_rows,countIf(arrayExists(x -> x IN ('[email protected]','[email protected]','000-00-0000','999-99-9999'),mapValues(SpanAttributes)))AS raw_span_attr_rowsFROM otel_tracesWHERE Timestamp >= (SELECT max(Timestamp) FROM otel_traces) - INTERVAL 30SECOND;
In a verified run after deploying the stateless transformation, the latest window showed redacted values in both maps and zero raw demo PII rows.
Choosing the Right ClickHouse Telemetry Architecture
There is more than one way to send OpenTelemetry data to ClickHouse. The right choice depends on how much operational complexity you want to own.
Architecture
Best fit
Trade-offs
OTel Collector → ClickHouse
Small prototypes and very simple pipelines
Minimal components, but limited room for deduplication, schema normalization, and controlled batching before storage
OTel Collector → Kafka → Consumers → ClickHouse
Large platforms with multiple downstream consumers, replay needs, or existing Kafka operations
Durable and flexible, but adds brokers, topics, partitions, consumer groups, lag monitoring, and extra cost
OTel Collector → GlassFlow → ClickHouse
Small and mid-sized teams that want production-grade telemetry ingestion without operating Kafka
Adds a focused streaming layer for OTLP ingestion, long-window deduplication, filtering, mapping, batching, backpressure, and horizontal scaling
The GlassFlow OTel Connector is a good fit when:
ClickHouse is your primary telemetry store.
You want to build an internal observability stack without taking on a full event-streaming platform.
You need practical safeguards like long-window deduplication, filtering of unneeded telemetry, schema mapping, batching, and DLQ visibility.
You expect throughput to grow and want a path to horizontal scaling; GlassFlow's published benchmark reaches about 510k events/sec with 10 ingestor and sink replicas.
You want to start with traces and later extend the same pattern to logs or metrics.
Kafka still makes sense when:
Multiple independent consumers need to read the same telemetry stream, for example ClickHouse, S3 archival, and real-time alerting.
You need durable replay across long retention windows.
Your company already runs Kafka well and telemetry is just another stream in that platform.
For many ClickHouse observability use cases, especially at small and mid-sized companies, GlassFlow gives you the processing layer you need without turning the telemetry project into a Kafka operations project. For the scaling details behind those numbers, see the GlassFlow performance benchmark.
Cleanup
make telemetry-removemake uninstallmake ns-removemake cluster-delete
make telemetry-removemake uninstallmake ns-removemake cluster-delete
make telemetry-removemake uninstallmake ns-removemake cluster-delete
Summary
For teams choosing ClickHouse as their telemetry store, GlassFlow provides a focused ingestion and processing layer between OpenTelemetry and ClickHouse. By accepting OTLP natively, GlassFlow can apply real-time deduplication over configurable windows, filter out telemetry you do not need, coerce schemas, and batch writes before telemetry reaches storage. When volume grows, the same architecture can scale horizontally; GlassFlow's benchmark shows about 510k events/sec at 10 replicas.
The repository demo focuses on traces end to end: span-level deduplication and stateless PII masking in GlassFlow, tail sampling in the OpenTelemetry Collector, and a single otel_traces table in ClickHouse viewable in HyperDX. The same OTLP receiver and header-based routing extend naturally to otlp.logs and otlp.metrics when you are ready.
All configuration files are available in demos/observability-v2. For step-by-step troubleshooting, port-forward notes, and API schema alignment details, see GUIDE.md. If you run into issues or have questions, open an issue on GitHub or reach out to the GlassFlow community.
We are also adding more native sources for GlassFlow and want to hear from the community. If you need a new source for GlassFlow, check out integrations and request access here.