ljn
Explore this complete anomaly detection guide
Written by
Armend Avdijaj
-

Anomaly Detection: A Beginners Guide
Anomalies are everywhere. From fraudulent transactions on e-commerce platforms to sudden spikes in server CPU usage, anomalies signal something unusual, unexpected, and often important. For developers, understanding how to detect anomalies can help you create a smarter and more resilient system.
In this article, we'll dive into the world of anomaly detection, explore its core concepts, and show you how to integrate it into your projects using the Python PyOD library. Whether you're building a fraud detection system or monitoring server performance, you'll walk away with actionable knowledge and code examples to get started.
In the next installment, we’ll take a deeper look at anomaly detection in real-time streaming settings. Some critical use cases such as detecting credit card fraud or cyberattacks on your e-commerce platform are usually done in real-time . We’ll also walk through a practical example of building an anomaly detection system for real-time data, so you can see how to implement these techniques in dynamic, real-world scenarios.
What is Anomaly Detection
At its core, anomaly detection is the process of identifying data points, events, or patterns that deviate significantly from the norm. In typical data analysis, these deviations or outliers are sometimes treated as a nuisance, but in anomaly detection, they can provide valuable insights.
By detecting anomalies early, businesses and developers can take proactive measures to mitigate risks.
Understanding Anomalies and Their Impact on Data
An anomaly is a record, observation, or value that is different from the remaining data points. They are also referred to as outliers, novelties, noise, deviations, and exceptions. In this article, I will use the terms anomaly and outliers interchangeably.
Anomalies can happen because of two things: real events that are extreme or errors introduced during data collection or processing. Whatever causes the anomalies, the steps we use to detect them are mostly the same. But how we choose to handle a particular anomaly depends on the root cause. Options for dealing with anomalies include investigation, removal, replacement with alternate values, and rescaling data. The choice heavily depends on your goal.
Without proper handling, anomalies can distort statistical analysis, mislead decision-making, and introduce biases in machine learning models, which in turn can reduce model accuracy and effectiveness. For example, a sudden traffic spike on a website might indicate a successful marketing campaign—or a cyberattack. Detecting and interpreting anomalies correctly is crucial for deriving meaningful insights from data.
Why is Anomaly Detection Crucial in Data Science?
Anomaly detection is important because anomalies often indicate important, rare, or potentially critical events that require immediate attention. If we can identify outliers, we can gain insights that can help us make better decisions. Whether in cybersecurity, finance, healthcare, or industrial monitoring, detecting anomalies can help prevent risks, uncover fraud, and improve system reliability.
Improves Data Quality & Integrity. Anomalies can distort insights and lead to incorrect conclusions. Detecting and handling them ensures that machine learning models and analytics remain accurate and reliable. Example: In data preprocessing, anomalies like missing values, duplicate entries, or incorrect sensor readings can skew results. Anomaly detection helps clean data before analysis.
Enhances Predictive Analytics & Machine Learning Models. Machine learning models rely on clean, well-structured data. Anomalies can cause overfitting (models learn noise instead of patterns) or misclassification (incorrect predictions). Example: A credit scoring model may mistakenly assign high risk to legitimate users due to anomalous spending patterns. Detecting and analyzing anomalies helps refine decision-making.
Critical for Fraud Detection & Security. Anomalies often indicate fraudulent activities, cyberattacks, or insider threats. Businesses and security teams rely on anomaly detection to mitigate risks. Example: In banking, an unusual spike in transactions from a single account could indicate fraud. In cybersecurity, multiple failed login attempts in a short time might signal a brute-force attack.
Essential for System & Operational Monitoring. Many industries rely on real-time anomaly detection to prevent failures, outages, and costly downtime. Example: A sudden drop in server response time could indicate a system failure. In industrial IoT, a temperature anomaly in a machine sensor might signal an impending breakdown.
Practical Applications of Anomaly Detection
Fraud Detection in Financial Transactions
Financial institutions use anomaly detection to combat fraud by analyzing transaction patterns. Machine learning models can flag suspicious transactions based on unusual spending behaviors, location mismatches, or deviations from a user's historical activity. This helps prevent credit card fraud, money laundering, and account takeovers in real time.
Cybersecurity and Network Monitoring
In cybersecurity, anomaly detection plays a vital role in identifying unauthorized access, malware infections, and data breaches. By monitoring network traffic and system logs, security tools can detect unusual activity—such as an employee accessing sensitive data at odd hours or a sudden surge in outbound traffic—allowing rapid response to potential threats.
Healthcare: Patient Monitoring and Equipment Safety
Anomaly detection enhances patient care by identifying irregularities in vital signs, such as abnormal heart rates or sudden drops in oxygen levels. Hospitals also use it to monitor medical equipment, detecting early signs of failure or malfunction, ensuring timely maintenance, and reducing the risk of critical system downtime.
E-commerce and User Behavior Analysis
Online retailers leverage anomaly detection to enhance customer experience and prevent fraudulent activities. It helps detect unusual purchasing behaviors, bot activity, and account takeovers. Additionally, e-commerce platforms use these techniques to optimize recommendation systems by identifying outlier shopping patterns and adjusting marketing strategies accordingly.
Manufacturing and Quality Control
In industrial settings, anomaly detection ensures product quality and equipment efficiency. Sensors on manufacturing lines collect data on temperature, pressure, and vibration levels, identifying deviations that may indicate defects or potential equipment failures. This enables predictive maintenance, reducing downtime and operational costs.
Types of Anomalies
Outliers in One-Dimensional data (Univariate)
A univariate outlier is an extreme value in a single variable, without considering relationships with other variables. These outliers are easier to detect using statistical methods like Z-score, IQR (Interquartile Range), or box plots.
Example: Salary distribution
Consider a dataset of employee salaries in a company. If most employees earn between $50,000 and $150,000, but one employee earns $10 million, this salary is a univariate outlier because it is extreme compared to the rest of the data.
Outliers in Multidimensional data (Multivariate)
A multivariate outlier is a data point that might not be extreme in any single variable but is unusual when considering the relationship between multiple variables. Detecting these outliers requires techniques like Mahalanobis Distance, Principal Component Analysis (PCA), or Machine Learning-based methods.
Example: Credit card fraud detection
Suppose a customer usually spends $50–$200 per purchase and shops within their home country. But they suddenly make a $5,000 purchase from a foreign location at an unusual time (e.g., 3 AM). Individually, spending $5,000 or shopping abroad might not be odd. But together, these features form a suspicious pattern—making this a multivariate outlier and a potential fraud case.
Anomaly Detection Approaches
Anomaly detection algorithms can be broadly categorized into three approaches: distance-based, density-based, and rank-based.
Distance-based: Points that are farther from others are considered more anomalous. Common algorithms include K-Nearest Neighbors (KNN) and Mahalanobis Distance.
Density-based: Points that are in relatively low-density regions are considered more anomalous. Examples include Local Outlier Factor (LOF) and Isolation Forest.
Rank-based: The most anomalous points are those whose nearest neighbors have others as nearest neighbors. This approach is less common but can be useful in specific contexts.
These approaches can be applied in supervised, semi-supervised, or unsupervised settings:
Supervised: Labels are known for a set of training data, and the model learns to distinguish between normal and anomalous data.
Semi-supervised: Labels are known for some data, but not for most. The model uses the labeled data to infer anomalies in the unlabeled data.
Unsupervised: No labels are known, so the model identifies anomalies based on the inherent structure of the data.
Step-by-step guide
Let's walk through a practical example of anomaly detection using the PyOD library in Python. PyOD is a comprehensive and scalable Python toolkit for detecting outlying objects in multivariate data.
Step 1: Install PyOD
First, you'll need to install the PyOD library. You can do this using pip:
Step 2: Import Libraries and Load Data
Next, import the necessary libraries and load your dataset. For this example, we'll use a synthetic dataset from PyOD.
Step 3: Initialize and Train the Model
We'll use the K-Nearest Neighbors (KNN) algorithm, a distance-based approach, to detect anomalies.
Step 4: Predict Anomalies
Once the model is trained, you can use it to predict anomalies in the test data.
Step 5: Evaluate the Model
Finally, evaluate the model's performance using metrics like precision, recall, and F1-score.
Which will print out something along the line of:
Note: the above table is for illustration only, since the data is generated dynamically, you will get different results.
Step 6: Visualize the Results
Visualizing the results can help you better understand the anomalies detected by the model.
This will generate something like the following:
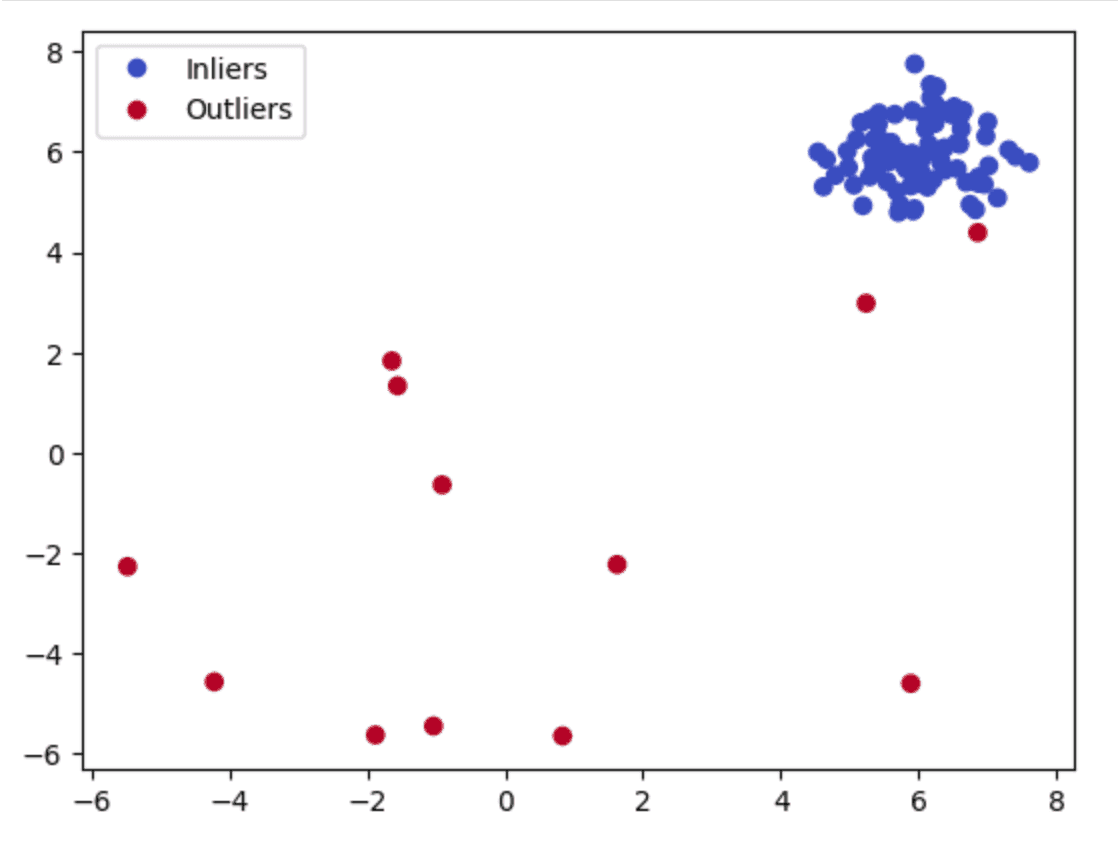
Note: you might see a different plot since the data is generated dynamically.
This simple example demonstrates how to use PyOD for anomaly detection. You can experiment with other algorithms like Isolation Forest, LOF, or PCA to see how they perform on your data.
Challenges
Despite its usefulness, there are some challenges when implementing anomaly detection:
Imbalanced Data: Anomalies are rare by definition, leading to highly imbalanced datasets. This imbalance makes it difficult for models to learn the characteristics of anomalies, often resulting in poor detection performance. Most models tend to favor the majority class (normal data), leading to high false-negative rates.
Defining Normal Behavior: Accurately defining what constitutes "normal" behavior is inherently challenging, especially in dynamic systems where normal behavior can evolve over time or vary across contexts. Without a clear understanding of normal behavior, distinguishing anomalies becomes unreliable.
High False Positive Rates: Anomaly detection systems often struggle with distinguishing true anomalies from noise or benign outliers. High false positive rates can lead to alert fatigue, reducing the system's effectiveness and trustworthiness, particularly in critical applications like fraud detection or cybersecurity.
Concept Drift & Evolving Anomalies: Anomalies change over time as systems, user behavior, and data patterns evolve. Static models may become obsolete, leading to an increase in false positives or missed anomalies. Continuous learning and adaptation are required to maintain accuracy.
Summary
Anomaly detection is a powerful tool for identifying unusual patterns in data, with applications ranging from fraud detection to system monitoring. In this guide, we explored the core concepts of anomaly detection, its importance in data science, and practical applications across various industries. We also walked through a step-by-step example using the PyOD library in Python, demonstrating how to detect anomalies in a dataset.
As technology evolves, so do the challenges in anomaly detection. There is a growing need for both general-purpose and specialized techniques that can adapt to emerging vulnerabilities and efficiently detect rare outliers in large data streams. By leveraging tools like PyOD and understanding the nuances of anomaly detection, you can build more robust systems and make better data-driven decisions.
Sources
Mehrotra, K. G., Mohan, C. K., & Huang, H. (2018). Anomaly Detection Principles and Algorithms (1st ed. 2017 edition). Springer.
Bruce, P., Bruce, A., & Gedeck, P. (2020). Practical Statistics for Data Scientists: 50+ Essential Concepts Using R and Python (2nd edition). O’Reilly Media.
Tanimura, C. (2021). SQL for Data Analysis: Advanced Techniques for Transforming Data into Insights (1st edition). O’Reilly Media.
Did you like this article? Share it!
You might also like
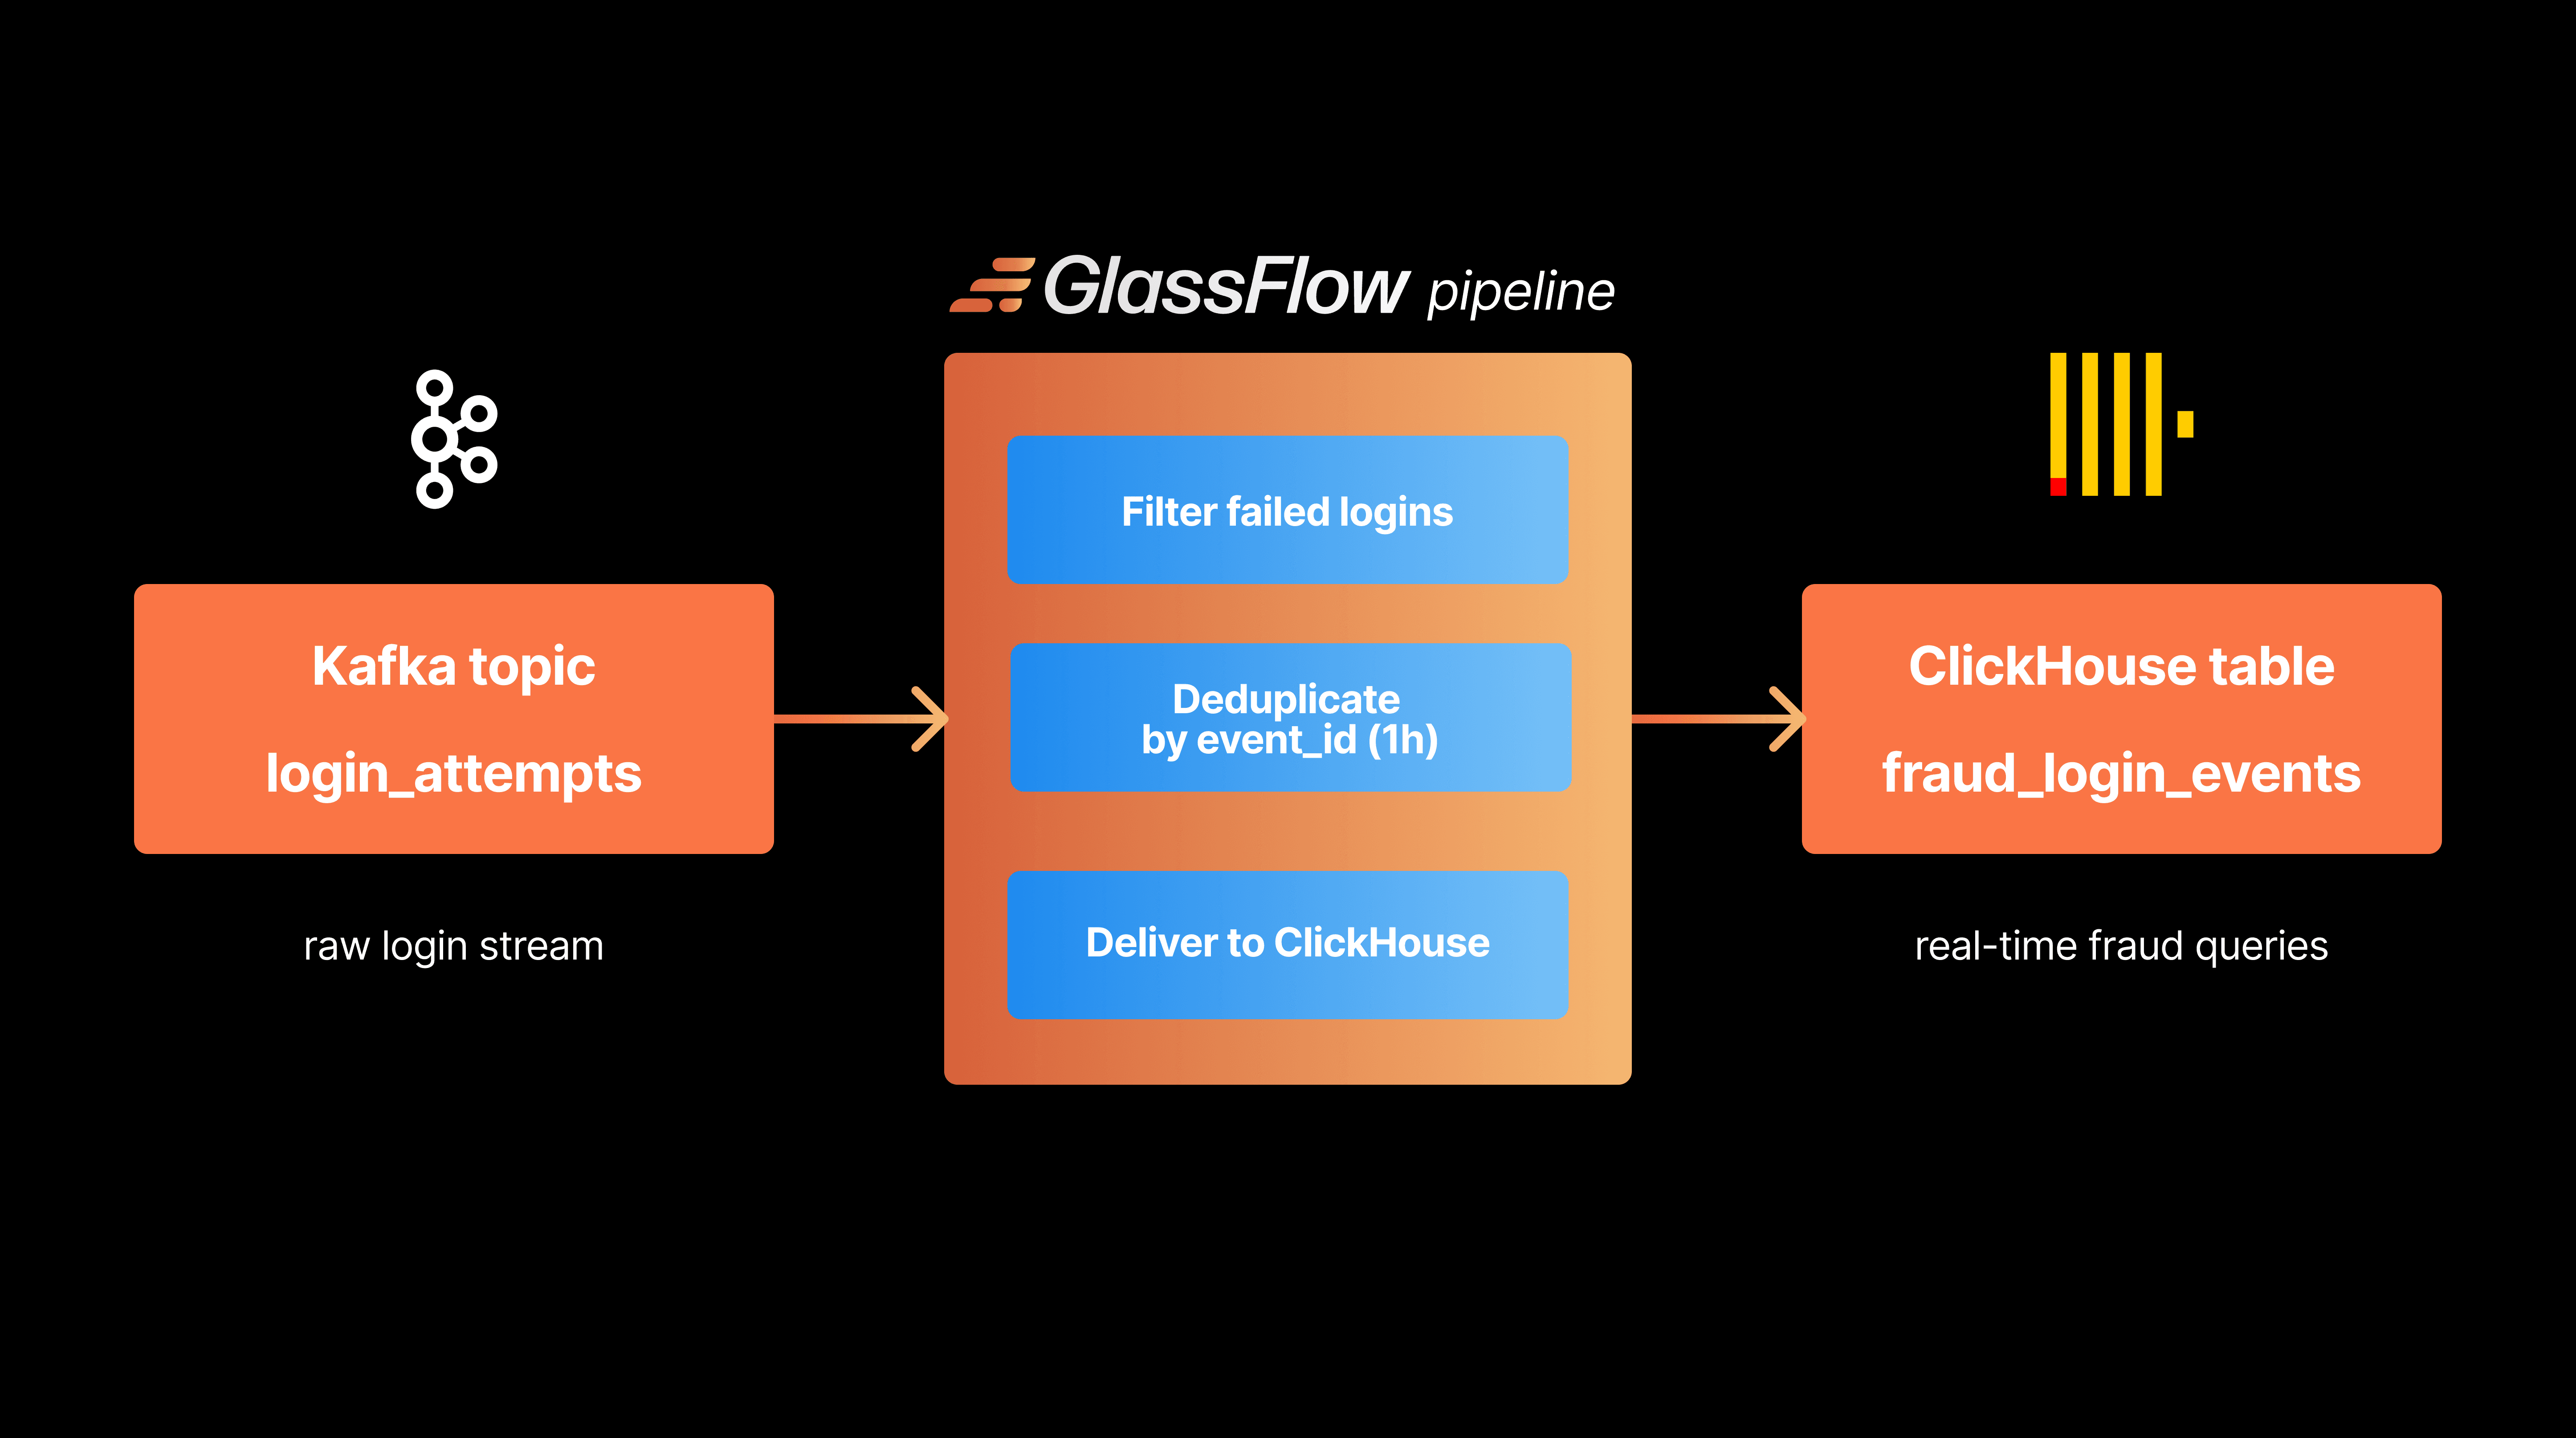


Data transformations at TB scale for ClickHouse
Get query ready data, lower ClickHouse load, and reliable pipelines at enterprise scale.
